Calculus For The Life Sciences
2nd Edition
ISBN:9780321964038
Author:GREENWELL, Raymond N., RITCHEY, Nathan P., Lial, Margaret L.
Publisher:GREENWELL, Raymond N., RITCHEY, Nathan P., Lial, Margaret L.
Chapter3: The Derivative
Section3.5: Graphical Differentiation
Problem 2YT
Related questions
Question
Solve d on the paper!

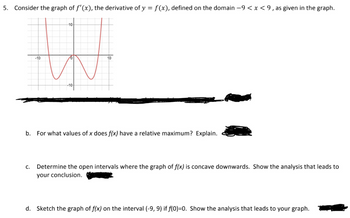
Transcribed Image Text:5. Consider the graph of f'(x), the derivative of y = f(x), defined on the domain -9 < x < 9, as given in the graph.
-10
W
-10
--10-
10

Transcribed Image Text:d. Sketch the graph of f(x) on the interval (-9, 9) if f(0)=0. Show the analysis that leads to your graph.
Expert Solution
This question has been solved!
Explore an expertly crafted, step-by-step solution for a thorough understanding of key concepts.
Step by step
Solved in 3 steps with 5 images

Follow-up Questions
Read through expert solutions to related follow-up questions below.
Follow-up Question
Solve b,c,d on the paper!!
For d, you need to sketch the graph!!

Transcribed Image Text:5. Consider the graph of f'(x), the derivative of y = f(x), defined on the domain -9 < x < 9, as given in the graph.
-10
W
-10
10
-10-
b. For what values of x does f(x) have a relative maximum? Explain.
C.
Determine the open intervals where the graph of f(x) is concave downwards. Show the analysis that leads to
your conclusion.
d. Sketch the graph of f(x) on the interval (-9, 9) if f(0)=0. Show the analysis that leads to your graph.
Solution
Recommended textbooks for you

Calculus For The Life Sciences
Calculus
ISBN:
9780321964038
Author:
GREENWELL, Raymond N., RITCHEY, Nathan P., Lial, Margaret L.
Publisher:
Pearson Addison Wesley,

Calculus For The Life Sciences
Calculus
ISBN:
9780321964038
Author:
GREENWELL, Raymond N., RITCHEY, Nathan P., Lial, Margaret L.
Publisher:
Pearson Addison Wesley,